

Why choose automated dashboards?
Modern businesses collect massive amounts of data from their marketing campaigns, e-commerce sales, and customer management. Yet, without structured and automated reporting, this data remains difficult to leverage .
Our automated dashboards , integrating Google Looker Studio and Reporting Ninja , allow you to:
• View your performance in real time and make informed decisions.
- Centralize all your marketing and e-commerce data in a clear and interactive interface.
- Automate the generation and sending of detailed reports for constant monitoring of your KPIs.
- Optimize your advertising campaigns, CRM, and e-commerce strategy with instant results.
With our advanced reporting solution, there's no need to manually extract and manipulate data . You get accurate, automated, and actionable reports that are accessible at any time.
A complete solution integrating Looker Studio and Reporting Ninja
We have designed an automated reporting system combining two complementary tools :
- Google Looker Studio for interactive and dynamic data visualization .
- Reporting Ninja for advanced automation and scheduled sending of detailed reports .
By combining these two tools, we guarantee tailor-made reporting that adapts to all business structures , whether you are in e-commerce, B2B or lead acquisition .

Why choose Bofu for your automated dashboards?
- A turnkey solution : We integrate and optimize Looker Studio and Reporting Ninja for a complete and effortless reporting experience .
- Centralization of data for better decision-making .
- Advanced customization : we build tailor-made dashboards based on your objectives and priority KPIs .
- Continuous monitoring and optimization to adjust and improve your reporting over time.
- Significant time savings by automating report sending and data updating.
With our solution, you get a 360° view of your performance , allowing you to optimize your marketing and sales strategies with complete confidence .
Ready to optimize your performance tracking?
Contact us today for a consultation and discover how our automated dashboards can revolutionize your marketing and e-commerce analysis !
Frequently Asked Questions
An automated dashboard is a tool that centralizes and displays your marketing, e-commerce and sales data in real time . It allows you to visualize your performance indicators (KPIs) without manual intervention , thus facilitating analysis and decision-making.
At Bofu , we integrate Google Looker Studio and Reporting Ninja to offer a complete and automated reporting solution . Looker Studio allows for interactive data visualization , while Reporting Ninja automates the generation and delivery of detailed reports .
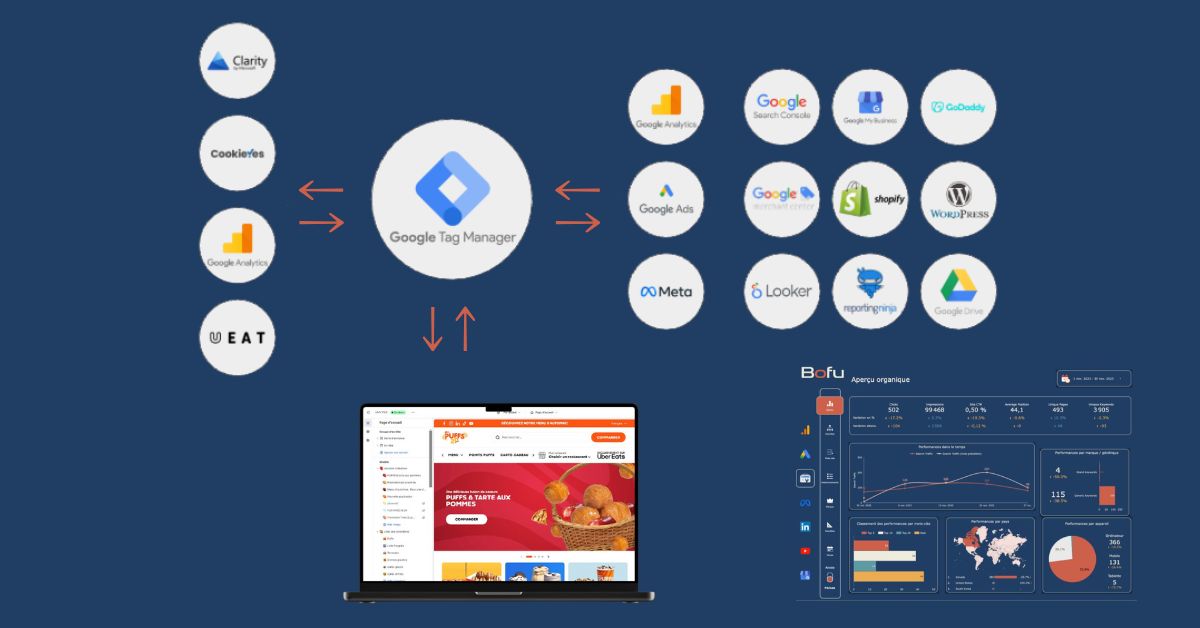
We can connect and analyze data from:
- Google Ads, Meta Ads, LinkedIn Ads, TikTok Ads
- Google Analytics 4 and Google Tag Manager
- Shopify and e-commerce platforms
- HubSpot, Salesforce and other CRMs
- Google Sheets, BigQuery, and Custom Databases
A dashboard is interactive and dynamic , allowing you to filter, explore, and segment data in real time . A static report, on the other hand, is a fixed document (PDF, Excel) that does not update automatically .
Yes, our dashboards allow you to centralize all your advertising campaigns (Google Ads, Meta Ads, LinkedIn, TikTok) and analyze their performance in a single interface .
Our dashboards allow you to:
- Track the performance of each advertising channel in real time .
- Compare results and identify the most profitable campaigns .
- Quickly adjust your marketing strategies based on the data collected.
Yes, we tailor each dashboard to your specific goals , with the KPIs that matter to your business, such as:
- Return on advertising investment (ROAS)
- Customer Acquisition Cost (CAC)
- Customer Lifetime Value (CLV)
- Conversion rate and average basket
Our dashboards can be updated in real time or at scheduled frequencies (hourly, daily, weekly). This depends on your data sources and business needs .
Yes, we use Reporting Ninja to automate the sending of detailed reports (PDF or interactive link) at a set frequency (daily, weekly, monthly).
Yes, our dashboards are compatible with all devices , including computers, tablets and mobiles for anytime access.
With clear, real-time visualization , you can identify trends, detect anomalies, and adjust your strategies quickly . This allows you to make decisions based on accurate data , rather than guesswork.
For an e-commerce site, key KPIs include:
- Turnover and sales development
- Conversion rate and average basket
- Customer Acquisition Cost (CAC)
- Shopping cart abandonment rate and customer loyalty
If you generate leads through a CRM like HubSpot, the key KPIs are:
- Number of qualified leads
- Lead to customer conversion rate
- Cost per lead (CPL) and cost per acquisition (CPA)
- Prospect Engagement and Sales Cycle Length
Yes, our dashboards include time filters that allow you to compare performance by day, week, month or year , in order to identify trends and adjust strategies.
We use secure API connections and validate each data source to avoid any errors or distortion in the display of results .
We connect Shopify directly with Looker Studio and Reporting Ninja , allowing you to track sales, average order value, conversion rate and customer behavior on your online store.
Yes, we can integrate data from Google Sheets, SQL databases, BigQuery and other custom sources , for further analysis.
If you spend too much time manually collecting and analyzing your data , an automated dashboard will help you:
- Save time and avoid human errors .
- Track your KPIs in real time effortlessly .
- Make decisions based on reliable and up-to-date data .
Contact us today for a consultation! We will assess your needs and implement a custom dashboard, fully automated and optimized for your business .